Incremental SAP Data Load to a Microsoft Fabric Medallion Lakehouse
This article shows how to configure a Microsoft Fabric pipeline for incremental SAP data ingestion, transformation, and reporting using the Medallion architecture. In a Medallion lakehouse, incremental SAP data is processed through Bronze, Silver, and Gold layers for Power BI reporting. This approach is compatible with all delta-capable extraction types, including TableCDC, ODP(OData) and DeltaQ.
About this Use Case
The business value of delta enabled SAP extractions in combination with a Medallion pipeline is highlighted in our blog post SAP Data in Microsoft Fabric: Medallion Pipeline for Real-Time Reporting.
The depicted scenario uses Xtract Universal's Table CDC extractions to replicate delta data from the following SAP tables in a Microsoft Fabric Lakehouse:
- KNA1 (customer master data)
- MARA (material master data)
- VBAK (sales document header)
- VBAP (sales document item)
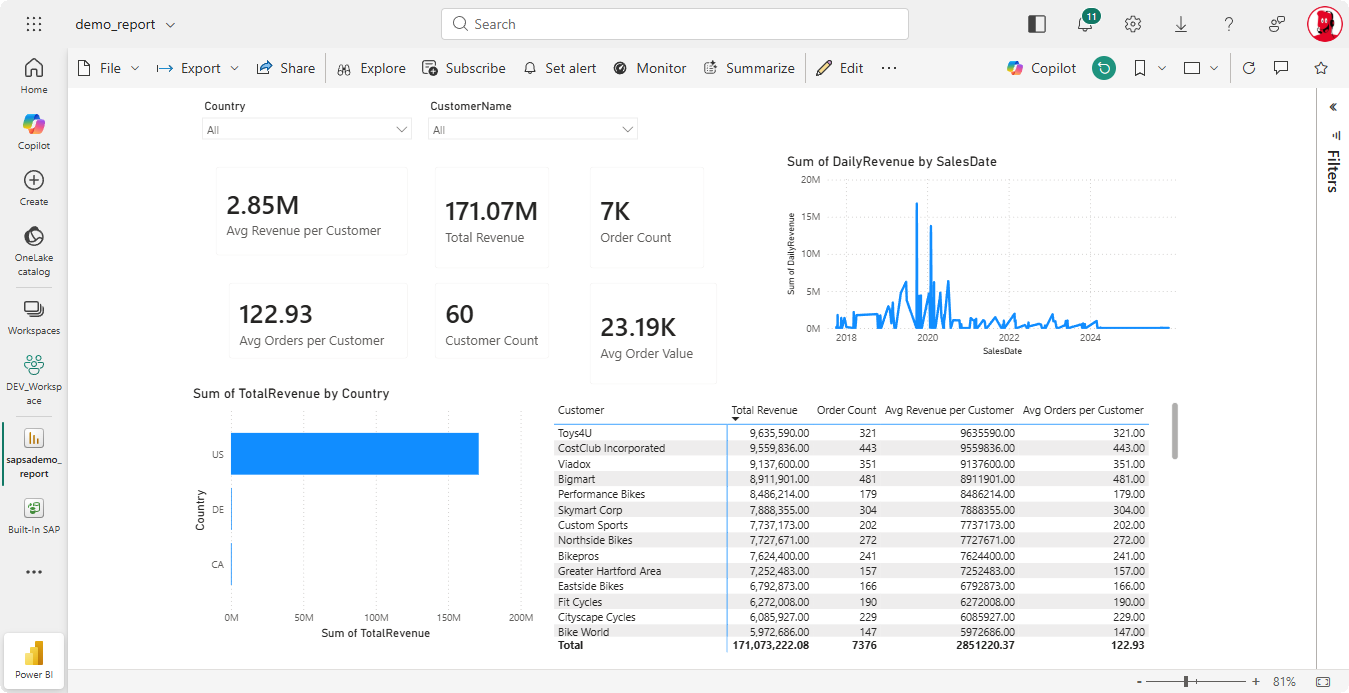
The data is processed through a Medallion Lakehouse pipeline to create a semantic model and a Power BI dashboard. The dashboard shows key customer and sales metrics like revenue and number of orders per customer or country.
About the Architecture
The scenario depicted in this article replicates SAP data into Microsoft Fabric using four logical layers:
| Layer | Format | Purpose |
|---|---|---|
| Landing Zone | Raw Parquet files, one folder per table | Incremental SAP data provided by Xtract Universal |
| Bronze | Raw delta tables that mirror SAP source tables | Merged copy of the SAP table |
| Silver | Cleansed and conformed delta tables | Business entity |
| Gold | Aggregated and analytics-ready delta tables | BI-ready metrics |
For more information, see Microsoft Documentation: Medallion Lakehouse Architecture.
Xtract Universal extractions write Parquet files containing incremental SAP data into a OneLake Lakehouse. This triggers an orchestrator pipeline. The pipeline processes the files, updates Bronze Delta tables, removes deleted records, and builds the Silver and Gold layers that serve as the source for semantic models and Power BI reports. The pipeline is configuration-driven, allowing new SAP tables to be onboarded without modifying pipeline logic.
The stages of this approach are illustrated in the following diagram:
flowchart LR
subgraph SAP Data Integration
A["SAP<br>↓<br> SAP Data Extraction & Replication"]
end
subgraph Ingestion
B["Landing Zone <br>(Parquet files)<br>↓<br> Orchestrator Pipeline<br>(+ Configuration File)<br>↓<br> Child Pipeline"]
end
subgraph Medallion Lakehouse
C["Bronze Layer <br>(Delta Tables)<br>↓<br> Silver Layer <br>(Business Entities)<br>↓<br> Gold Layer <br>(Aggregation)"]
end
subgraph Analytics
D["Semantic Model <br>↓<br> Power BI Reports"]
end
A --> B
B --> C
C --> DThe depicted scenario uses the following folder structure inside the Lakehouse:
- Tables/
- bronze (each Medallion layer has its own schema)
- silver
- gold
- Files/
- config/ (contains the JSON file that defines the primary keys of each table)
- pipeline-config.json
- incremental/ (landing zone for incoming Parquet files)
- kna1/ (each table has its own subfolder)
- kna1_20260620_0800.parquet (filenames use a timestamp for chronological sorting and to prevent overwriting)
- kna1_20260622_0800.parquet (← newest)
- mara/
- mara_20260620_0800.parquet
- vbak/
- vbak_20260622_0600.parquet
- vbap/
- vbap_20260622_0600.parquet
- kna1/ (each table has its own subfolder)
- failed/ (files that fail during pipeline execution are moved to this folder for later analysis)
- processed/ (files from the incremental directory are moved here after successful processing)
- config/ (contains the JSON file that defines the primary keys of each table)
Prerequisites
- Microsoft Fabric OneLake destination in Xtract Universal.
- A delta-capable extraction, e.g., TableCDC, ODP(OData) or DeltaQ.
- Basic knowledge of Microsoft Fabric, including pipelines, notebooks, and semantic models.
- Microsoft account with access to Microsoft Fabric OneLake and permissions to:
- create pipelines
- create notebooks
- create semantic models
- create Power BI reports.
Setup in Xtract Universal
To use Xtract Universal to write incremental SAP data as Parquet files to the Microsoft Fabric OneLake landing zone:
- Create a Microsoft Fabric OneLake destination that connects to your lakehouse.
- In the File format tab of the Destination Details, select Parquet from the File type dropdown.
- Create a delta-capable extraction for every SAP object you want to track in Microsoft Fabric. The depicted example uses a Table CDC extraction to record data changes in SAP tables KNA1, MARA, VBAK, and VBAP.
- Assign the Microsoft Fabric OneLake destination to the extractions.
-
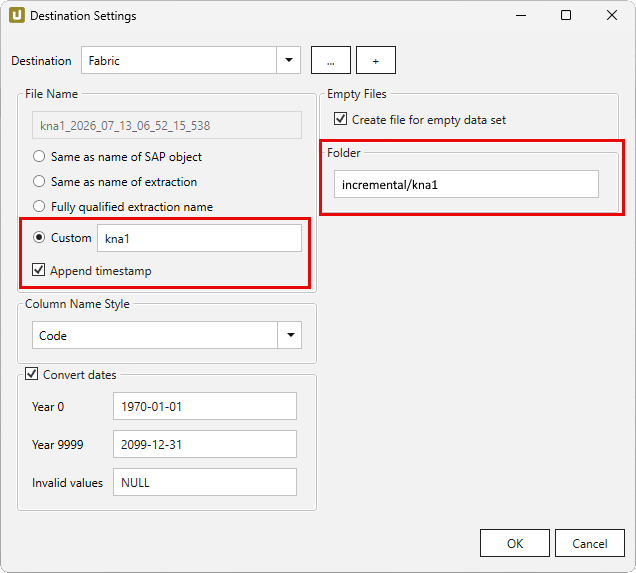
For each extraction, use the following Destination Settings to create the required infrastructure in the landing zone of the Lakehouse:
- In the input field Folder, enter
incremental/[sap object], e.g.,incremental/kna1. - In the File Name settings, enable Custom and enter the name of the SAP object.
- Enable the checkbox Append timestamp
- In the input field Folder, enter
-
Schedule the extractions to run at a desired frequency, e.g., every 5 minutes, see Execute and Automate.
The Parquet files are written to the Microsoft Fabric OneLake landing zone and are ready for processing.
Pipeline Setup
Microsoft Fabric processes the SAP data with an orchestrator pipeline and a child pipeline. The SAP tables and their business keys are defined in an external JSON configuration file to keep maintenance and new table onboarding separate from pipeline activities.
Configuration File
A central JSON file stored in the lakehouse configuration folder controls the processing logic of the orchestration pipeline. This file defines the landing folder of each SAP table, the Bronze table name, and the business key columns used for upsert/merge.
Create the following configuration file:
- File name:
pipeline-config.json. - Location: Store the file in the lakehouse configuration folder
Files/config. -
Content: For each SAP table, add the following items:
Field Description FolderName Landing subfolder that contains the Parquet files TableName Name of the Bronze Delta table to create / maintain KeyColumns Columns that uniquely identify a row (merge key)
To add a new SAP table later, add an entry to pipeline-config.json.
[
{
    "FolderName": "mara",
    "TableName": "mara",
    "KeyColumns": ["MANDT", "MATNR"]
},
{
    "FolderName": "kna1",
    "TableName": "kna1",
    "KeyColumns": ["MANDT", "KUNNR"]
},
{
    "FolderName": "vbak",
    "TableName": "vbak",
     "KeyColumns": ["MANDT", "VBELN"]
},
{
    "FolderName": "vbap",
    "TableName": "vbap",
    "KeyColumns": ["MANDT", "VBELN", "POSNR"]
}
]
Orchestrator Pipeline
The orchestrator pipeline controls the overall workflow for integrating SAP data into the layers of the Medallion lakehouse architecture in Microsoft Fabric.
Trigger
- Use a Storage Event Trigger to run the pipeline whenever a new Parquet file is written to OneLake.
- Pass
@triggerBody().folderPathinto the pipeline as a parameter to identify which table to process. - Filter
@triggerBody().folderPathby the.parquetsuffix to avoid false fires.
Processing Steps
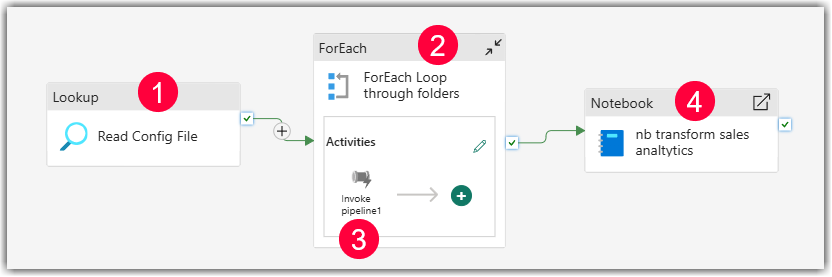
- A Lookup activity loads the
pipeline-config.jsonfile as a JSON array. - A ForEach activity iterates through all configured SAP tables.
- An Invoke Pipeline activity executes a child pipeline that loads all SAP tables into the Bronze layer. The following parameters are passed to the child pipeline:
- FolderName:
@item().FolderName - TableName:
@item().TableName - KeyColumns:
@item().KeyColumns - FolderPath:
@item().FolderPath
- FolderName:
- After all Bronze loads complete successfully, a Notebook activity builds the Silver and Gold layers.
Child Pipeline
The child pipeline runs once per table/folder. It loads new Parquet files into the Bronze delta table.
Processing Steps
- A Get Metadata activity identifies and lists available Parquet files in the landing zone.
- A Filter activity selects all
.parquetfiles. - A Notebook activity that uses the standard data pipeline
ppl_copy_upsert_nb01sorts the files chronologically. - A ForEach activity processes files in timestamp order to preserve CDC consistency.
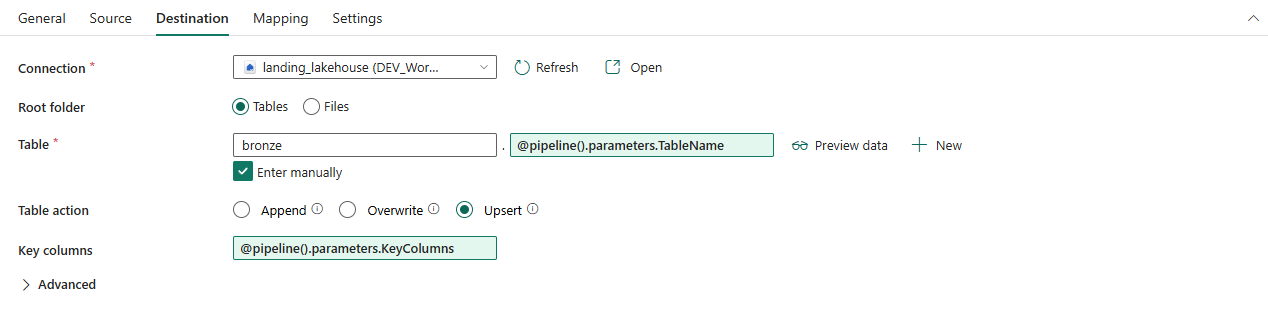
- A Copy Data activity inside the loop loads records into a Bronze Delta table. Make sure to enable the option Upsert in the Destination settings of the activity.
- A Copy Data activity inside the loop archives successfully processed files to
processed/<table>. - A Delete Data activity inside the loop removes the source files from the
incremental/folder. - A Notebook processes delete indicators and removes deleted records from the Bronze table, see Handling SAP Deletes.

Handling SAP Deletes
Microsoft Fabric's Copy Data activity supports inserts and updates during upsert operations. Row deletion is not supported.
To delete rows, the child pipeline executes a dedicated notebook after a file is loaded into the Bronze layer. The notebook reads the delete indicators from the Bronze table, identifies matching records, and removes them from the Bronze table. This ensures that the Bronze layer remains a 1:1 replication of the SAP source instead of an append-only history table.
The notebook for deleting rows consists of the following 2 cells:
# 1. Capture parameters from the pipeline
# Make sure to toggle "Parameter cell" on for this cell in the Notebook UI
TableName = "mara"
import json

try:
    print(f"Starting purge for table: {TableName}")
    # Now you can run your query safely
    spark.sql(f"DELETE FROM landing_lakehouse.bronze.{TableName} WHERE TS_OPERATION = 'D'")

    print("Purge completed successfully.")
except Exception as e:
    print(f"Error executing purge: {str(e)}")
    raise e
Build Silver & Gold Layers
The orchestrator pipeline executes a notebook to build the Silver and Gold layers from Bronze tables.
The Silver layer converts the source tables from the Bronze layer into business-oriented entities. The notebook selects and renames columns, filters out rows with null values in the primary key columns, and writes the result into the following Silver delta tables:
- SalesOrder
- Build from: VBAK (VBELN, ERDAT, KUNNR, VKORG) and VBAP (POSNR, MATNR, KWMENG, NETWR)
- Customer
- Build from: KNA1 (KUNNR, NAME1, LAND1)
The Gold layer contains aggregated datasets optimized for reporting and analytics. The notebook joins the Silver tables, aggregates the data, and writes the result into the following Gold delta tables.
-
CustomerRevenue
- Built from: Customer + SalesOrder
- Use cases: Customer profitability, revenue ranking and customer segmentation
-
DailySales
- Built from: SalesOrder
- Use cases: Trend analysis, daily performance monitoring and time-series reporting
Create a new notebook in Microsoft Fabric and add the code snippets below to build the Silver and Gold tables:
# import
from pyspark.sql.functions import col

# Read Bronze tables
customer_df = spark.table("kna1")
header_df = spark.table("vbak")
position_df = spark.table("vbap")

# Build the Silver table for sales orders
# Select and rename specific columns
sales_order_silver = (
    header_df.alias("h")
    .join(position_df.alias("p"), col("h.VBELN") == col("p.VBELN"), "inner")
    .select(
        col("h.VBELN").alias("OrderID"),
        col("h.ERDAT").alias("OrderDate"),
        col("h.KUNNR").alias("CustomerID"),
        col("h.VKORG").alias("SalesOrganization"),
        col("p.POSNR").alias("PositionID"),
        col("p.MATNR").alias("ProductID"),
        col("p.KWMENG").alias("Quantity"),
        col("p.NETWR").alias("NetAmount")
    )
    .filter(col("h.VBELN").isNotNull())
    .filter(col("h.KUNNR").isNotNull())
)

sales_order_silver.write.mode("overwrite").format("delta").saveAsTable("SalesOrderSilver")
# Build the Silver table for customer data
# Select columns and rename them
customer_silver = (
    customer_df
    .select(
        col("KUNNR").alias("CustomerID"),
        col("NAME1").alias("CustomerName"),
        col("LAND1").alias("Country")
    )
    .filter(col("KUNNR").isNotNull())
)

customer_silver.write.mode("overwrite").format("delta").saveAsTable("CustomerSilver")
# Build the Gold table for customer revenue.
# Create the first KPI table:
#   - Join the tables.
#   - Aggregate the data.

from pyspark.sql.functions import sum as _sum, countDistinct

sales_order_silver = spark.table("SalesOrderSilver")
customer_silver = spark.table("CustomerSilver")

customer_revenue_gold = (
    sales_order_silver.alias("s")
    .join(customer_silver.alias("c"), col("s.CustomerID") == col("c.CustomerID"), "inner")
    .groupBy(
        col("c.CustomerID"),
        col("c.CustomerName"),
        col("c.Country")
    )
    .agg(
        _sum("s.NetAmount").alias("TotalRevenue"),
        countDistinct("s.OrderID").alias("OrderCount")
    )
)

customer_revenue_gold.write.mode("overwrite").format("delta").saveAsTable("CustomerRevenueGold")
# New Gold Table for daily revenue

from pyspark.sql.functions import to_date

daily_sales_gold = (
    sales_order_silver
    .withColumn("SalesDate", to_date(col("OrderDate")))
    .groupBy("SalesDate")
    .agg(_sum("NetAmount").alias("DailyRevenue"))
)

daily_sales_gold.write.mode("overwrite").format("delta").saveAsTable("DailySalesGold")
Semantic Model and Power BI Report
The Gold layer serves as the foundation for a Fabric semantic model. The semantic model defines relationships between business entities, see Microsoft Documentation: Power BI semantic models in Microsoft Fabric.
The depicted use case defines the relationships between CustomerRevenue and DailySales:
-
customerrevenue
Country
Customer ID
CustomerName
∑ OrderCount
∑ TotalRevenue -
dailysales
SalesDate
∑ DailyRevenue
A Power BI report is built on the semantic model to visualize customer and sales metrics such as revenue and order count by customer or country.
For more information, see Microsoft Documentation: Create reports in the Power BI service in Microsoft Fabric and Power BI Desktop.
Related Links
- SAP Data in Microsoft Fabric: Medallion Pipeline for Real-Time Reporting
- Microsoft Documentation: Medallion Lakehouse Architecture
- Microsoft Documentation: Create a Semantic Model
- Microsoft Documentation: Transform data by running a notebook
Last update: October 19, 2026
Written by: Khoder Elzein, Valerie Schipka